Article
Which of Your Ecommerce Products Deserve to Scale?
By Deacon Bradley · July 10, 2026
Flywheels, bridges, and treadmills.
Customers loved our protein line. Every dashboard said scale it.
The profit math said it was a treadmill.
This is the two-number analysis that caught it, and how to run it on your own catalog.
One of the brands in our portfolio (we hold a minority stake) sells fitness supplements. About a million a year in revenue, a catalog that had sprawled to ten product lines and nearly thirty live flavors, and a founding team that spent a scary amount of time panicking about inventory.
Every few weeks something went out of stock. And when you’re running thirty flavors on a small brand’s cash, something is ALWAYS about to go out of stock. You order in small quantities because cash is finite. Small quantities run out fast. So the reorder cycle becomes a fire drill: rush the PO, juggle the cash, apologize to customers, repeat.
It looks responsible. It feels like protecting revenue. Every stockout is a sale you didn’t make, right?
Stay with me, because the data told a different story. And the most surprising part wasn’t which products were winning.
Why does every product look worth saving?
Stockout panic treats every product as equally worth saving, and nothing in the standard toolkit tells you otherwise. The P&L can’t. It’s one number for the whole business. Sales-by-product can’t help, because every product sells. On a revenue dashboard, all thirty flavors look alive. All thirty look like they deserve the rush order.
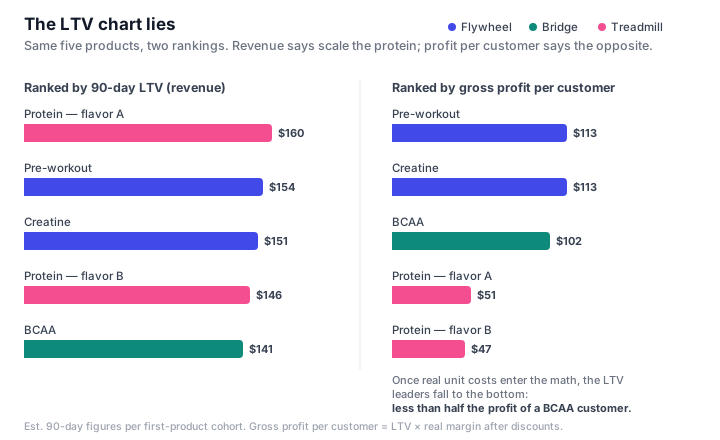
And LTV will actively lie to you. In this catalog, the protein line sat at the very top of the lifetime-value chart. Customers who entered through protein were worth $146–160 over ninety days, more than almost anything else we sold, with the third-highest repeat rate in the catalog. Every dashboard said: lean in.
How do you find out which products actually compound?
I asked a different question. Not which products customers love. Which products actually compound?
Two numbers answer it, and almost nobody looks at them together.
The first is repeat behavior. Of the customers whose first purchase was this product, how many are back within thirty days? Not the store’s repeat rate. Repeat rate keyed to the product that brought each customer in the door.
The second is real margin: net price after every discount, minus what the unit actually costs. Multiply the two through and you get the number that matters, gross profit per customer by entry product. This is where marketing thinking and finance thinking finally meet. Marketing knows the repeat rates. Finance knows the margins. In most brands this size, those two numbers have never been in the same table.
I pulled every order into our data warehouse and built the models. (There’s a by-hand version of this too. I’ll give it to you in a minute.)
What are flywheel, bridge, and treadmill products?
The catalog sorted itself into three roles.
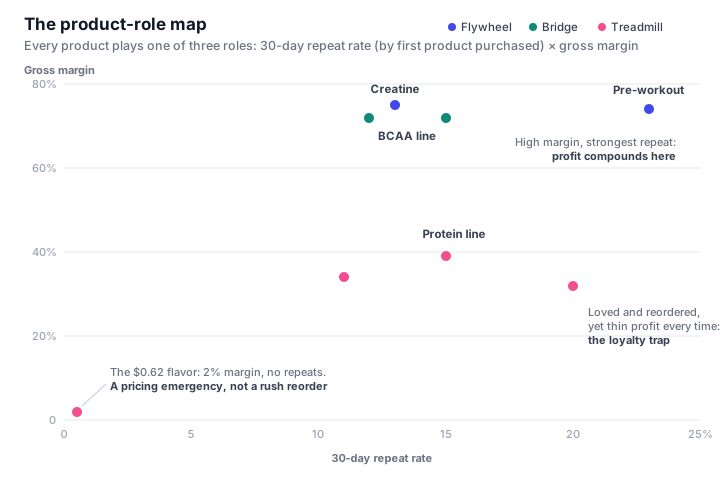
The flywheel. Two products, creatine and our pre-workout, had both numbers at once: 74–75% margin and the strongest repeat behavior in the catalog. The pre-workout brings nearly one in four customers back within thirty days. Daily-use products run on a biological clock: customers reorder because they run out. And because acquisition was already paid for on order one, every reorder at that margin is nearly pure profit: $27–28 of gross profit on a typical reorder, compounding indefinitely. A customer who enters here is worth about $113 in gross profit inside ninety days. This is what a compounding brand is built on.
The bridge. The BCAA line: same high margins, moderate repeat, big customer bases. Around $94–107 of gross profit per customer. Not as fast-cycling as creatine. But every reorder is highly profitable, and it’s an accessible first purchase that leads customers into the daily-use products. Strong acquisition products.
The loyalty trap. The protein line, the LTV chart-topper. A 20% thirty-day repeat rate; customers genuinely love it and come back for it. And it’s still a bad product to scale. The unit costs $34.50 against a ~$51 price: 32% margin. Each loyal reorder generates about $16 of gross profit, versus $27 for a BCAA reorder. Over ninety days, a protein customer produces $47–51 of gross profit.
Less than half a BCAA customer. And on every revenue report, it looks like a star.
The loyalty is real. The economics don’t compound. Scaling this product means paying to acquire customers who will faithfully run a treadmill, not a flywheel.
And buried at the bottom of that table was the detail that still bothers me: one flavor, heavily discounted, was selling at a unit margin of $0.62. Two percent. Every rush reorder of that flavor was an emergency response to protect sixty-two cents a unit.
Where was the ad budget actually going?
When we lined the ad spend up against the table, the mix was heaviest on the treadmill end (the well-loved, low-margin products) while the two flywheel products sat under-advertised relative to their long-term value. The growth budget was pointed at exactly the wrong end of the catalog. We weren’t just tolerating the treadmill. We were paying to put more customers on it.
Everything about allocation follows from the table. Acquire with the bridge products, cross-sell into the flywheel, and let the daily-use habit do the compounding. A stockout on the flywheel is a five-alarm fire: that’s a compounding customer relationship turned away at the door. A stockout on a treadmill product is a rounding error wearing an emergency’s clothes. And the sixty-two-cent flavor doesn’t need a rush PO; it needs a repricing.
Why build this as infrastructure instead of a one-time analysis?
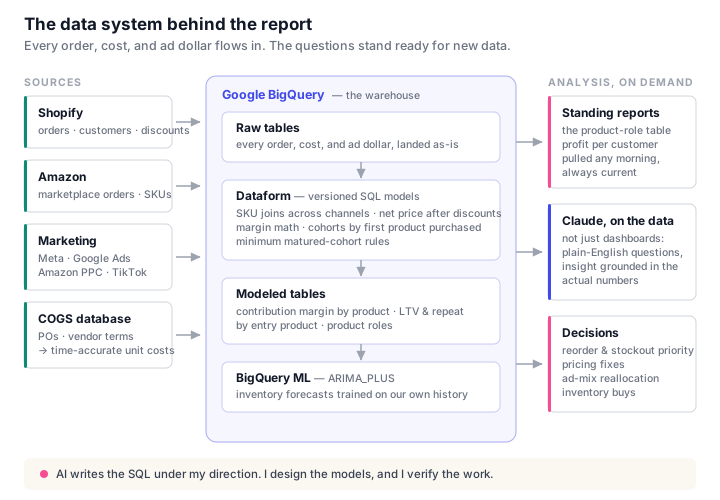
I didn’t do this analysis in a spreadsheet. Every order flows into a data warehouse (BigQuery, with AI writing most of the SQL under my direction), and the margin math, the cohort windows, and the minimum sample sizes live in models, not in a file. So this table isn’t a project I did once. It’s a standing report I can pull any morning with current data, as cohorts mature, discounts change, and new products launch.
Some of the best findings come from exactly that. A recent run surfaced a brand-new hydration flavor, too young to appear in the ninety-day view at all, already showing one of the highest margins in the catalog with strong early reorders. A flywheel candidate, caught five weeks in, while the signal was still cheap to act on. An analysis from last quarter would never have seen it. The question stands ready and the data comes to it.
How do you build the by-hand version?
If you don’t have that infrastructure, there’s still a by-hand version, and it’s worth doing once. Export a year of orders. Tag each customer with the first product they bought. Count how many were back within thirty days, per product. Work out net price after discounts, subtract real unit cost, and multiply through to gross profit per customer. Never rank products by revenue LTV. Rank them by gross profit per customer, then sort them into the three roles: flywheel, bridge, treadmill.
Simple is not the same as easy. There are three places this analysis breaks, and they’re where most attempts die. First, your COGS are probably wrong. Most brands this size don’t have time-accurate unit costs, and if the cost numbers are fiction, every number downstream is fiction wearing a spreadsheet. I spent months getting the bookkeeping right before I trusted a single row of this table. Second, discounts hide in net price. At list price, the sixty-two-cent flavor looked fine; it took actual line-level discount math to expose it. Third, small cohorts lie. A product with twenty customers will show you noise and call it a trend. My models enforce minimum matured cohort sizes and fixed time windows before a row earns a place in the table.
And go in knowing what the by-hand version is: a photograph. It starts aging the day you finish it. Cohorts keep maturing, costs drift, new products launch outside the frame. It will still show you which of those three problems your business has, and it may well change your next reorder and your ad mix. That’s worth a weekend. But it’s also why I built this as infrastructure instead of an analysis: this question is too important to answer once.
The uncomfortable part is that none of this was hidden. It was sitting in the order history the whole time. What was missing was the question. When marketing owns one number and finance owns the other, nobody ever puts them in the same table.
Which of your best-loved products are treadmills? If you can’t answer that from numbers you trust, that’s the most profitable question in your business right now.
Frequently asked questions
What is a loyalty-trap product?
A product customers genuinely love and reorder often, but whose margin is too compressed for those reorders to compound. In this catalog, the protein line had a 20% thirty-day repeat rate (third-highest) but only 32% gross margin, so each loyal reorder generated about $16 of gross profit versus $27 for a high-margin product. The loyalty is real; the economics don't compound.
Why is LTV misleading for ranking products?
LTV measures revenue, not profit. A product can top the lifetime-value chart and still produce less than half the gross profit per customer of a mid-chart product once real unit costs enter the math. Rank products by gross profit per customer (LTV multiplied by real margin), never by revenue LTV alone.
How do you calculate gross profit per customer by product?
Tag each customer with the first product they bought. Measure what that cohort spends over 30 and 90 days. Compute real margin from net price after discounts minus true unit cost. Multiply through to get gross profit per customer by entry product, and enforce minimum matured cohort sizes so small samples don't masquerade as trends.
What are flywheel, bridge, and treadmill products?
Flywheels have high margin and high repeat: daily-use products whose reorders are nearly pure profit. Bridges have high margin and moderate repeat: strong acquisition products that lead customers into the flywheel. Treadmills have high repeat but compressed margin: customers loyally come back and generate thin profit every time. Acquire with bridges, cross-sell into flywheels, and stop scaling treadmills.
Who is Deacon Bradley?
Deacon Bradley is an ecommerce operator and investor who buys brands and builds the AI systems that run them. He acquires and operates lean DTC health, beauty, and supplement brands.
I share what's actually working.
Operator-to-operator notes on AI and financial rigor in lean ecommerce.
Subscribe to My Newsletter